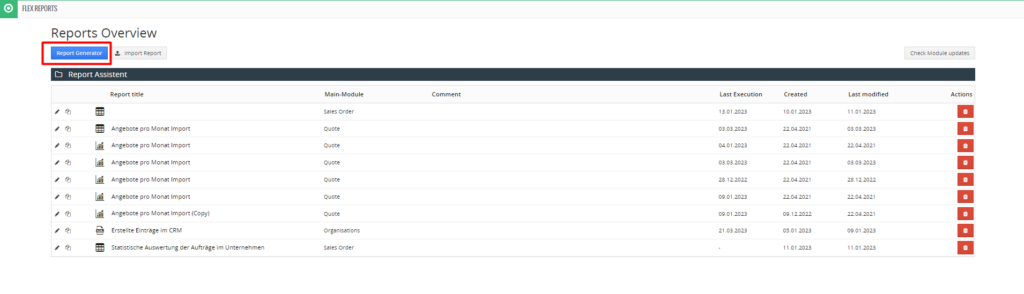
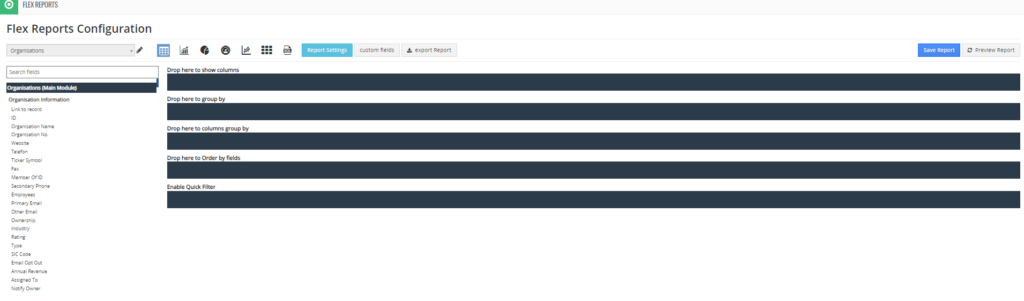
To add a new report, click here:
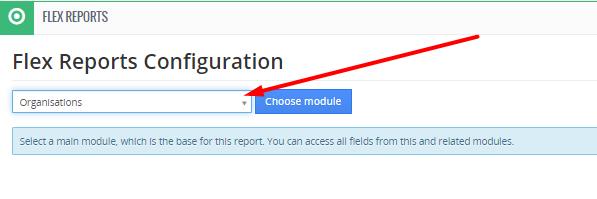
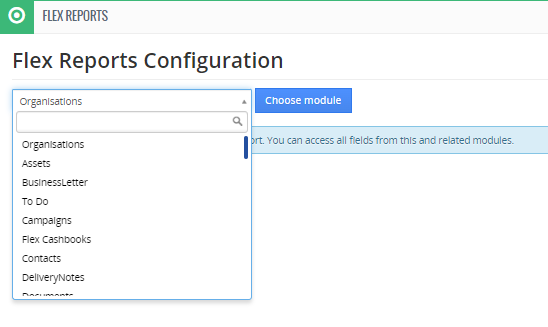
From the list, select the module on the basis of which the report will be created.
And click on “Select module”
Here you can see all the possibilities of report creation conditions
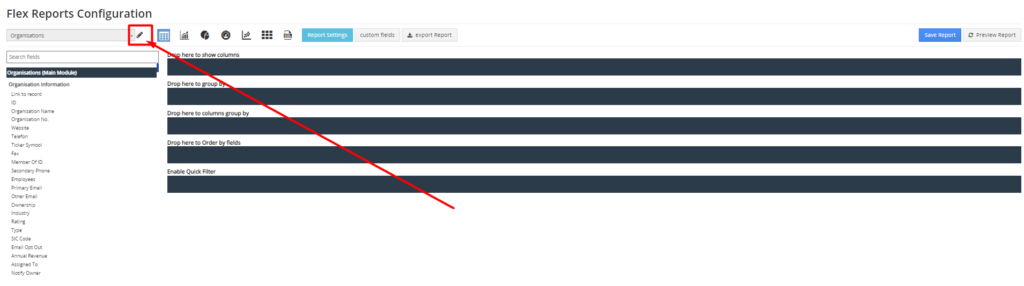
If you want to change the module, click here
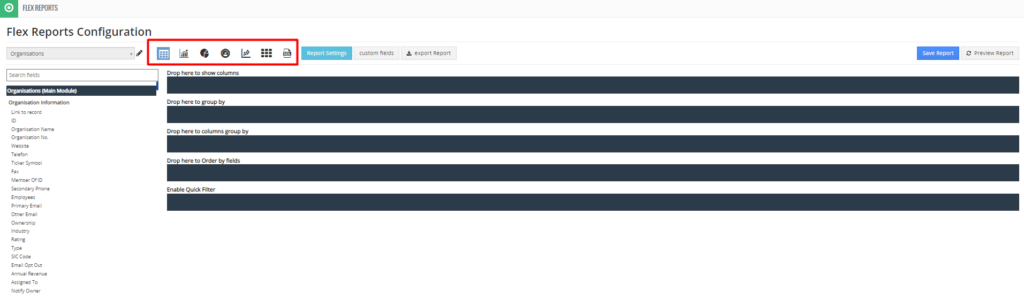
In this area you can select the type of your report:
- Table
- Histogram
- Pie Chart
- Gauge Chart
- Point Chart
- Heatmap Chart
- SQL Queries
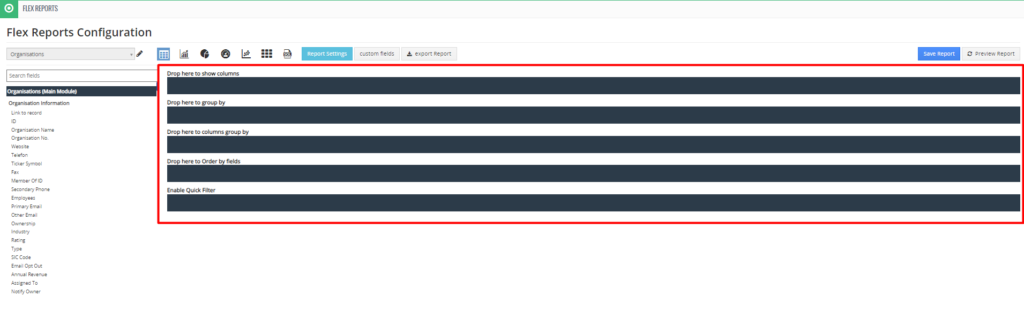
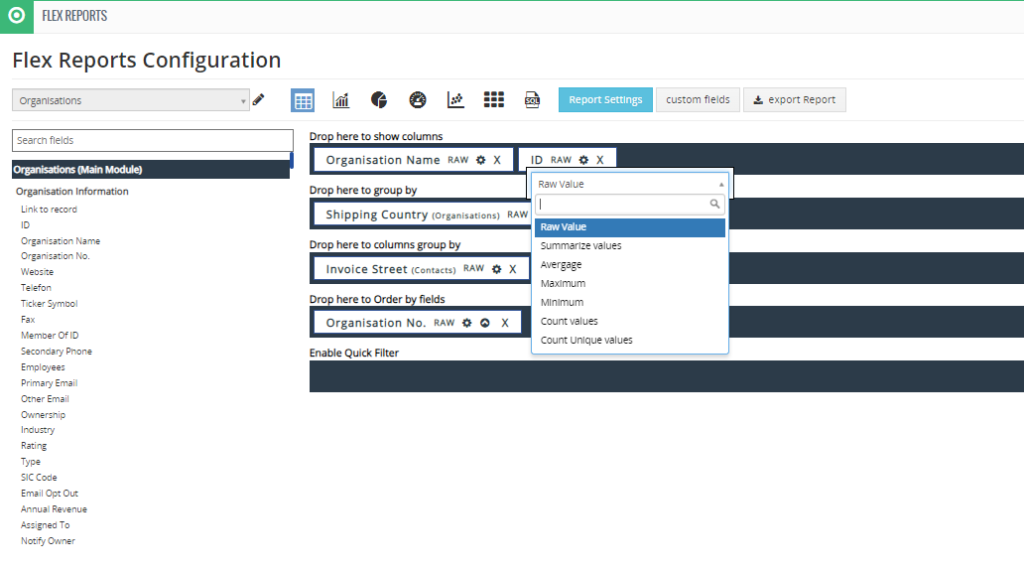
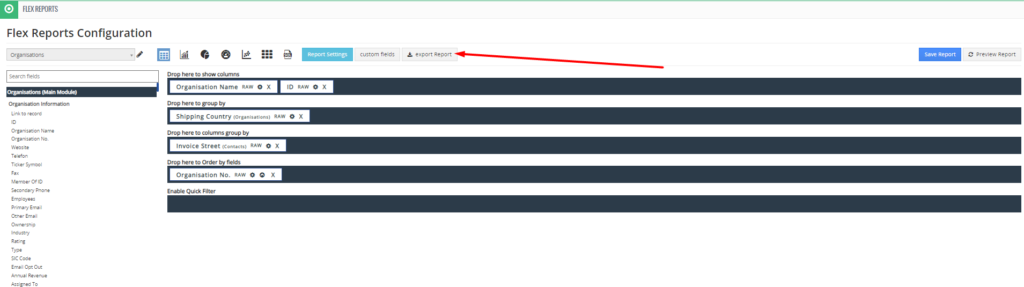
On the left you can see all the fields of the module you selected and the fields of the related modules.

On the right you place the fields according to which your report will be created, depending on which view you have chosen. Select the values on the left and drag and drop them into the areas on the right:
- Drop here to display columns
- Here you can group by
- Here you can group the columns by
- Here you can sort by fields
- Switch on quick filter
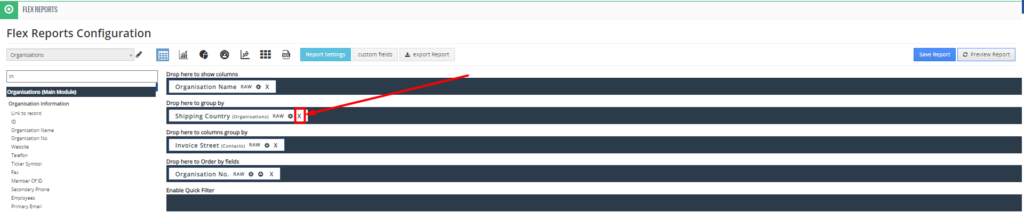
To remove the selected field, click here
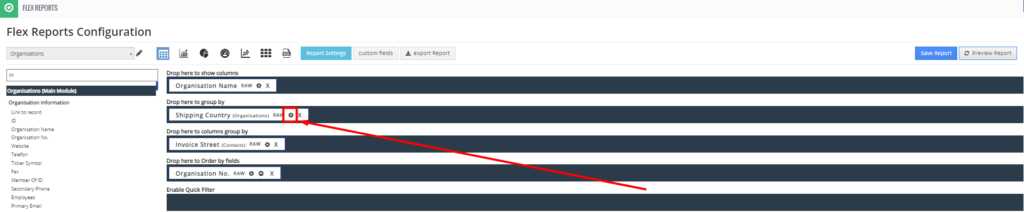
To change the field click here
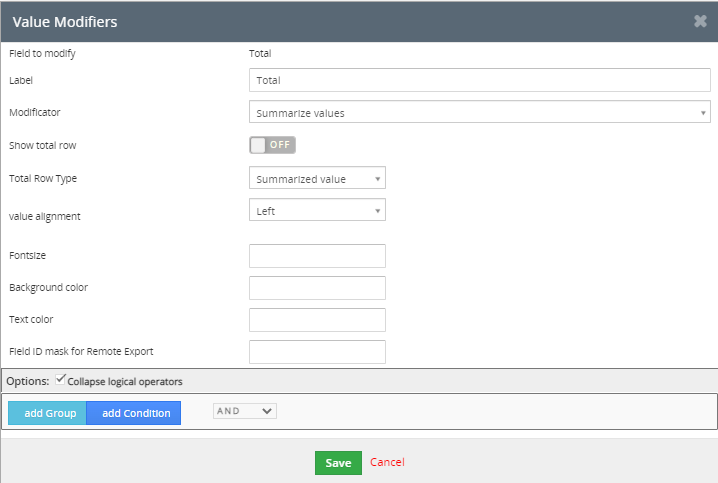
A window with the corresponding fields will appear:
- Field to be changed
- Label
- Modifier
- Show entire line
- Total line type
- Value adjustment
- Font size
- Background color
- Text color
- Field ID mask for remote export
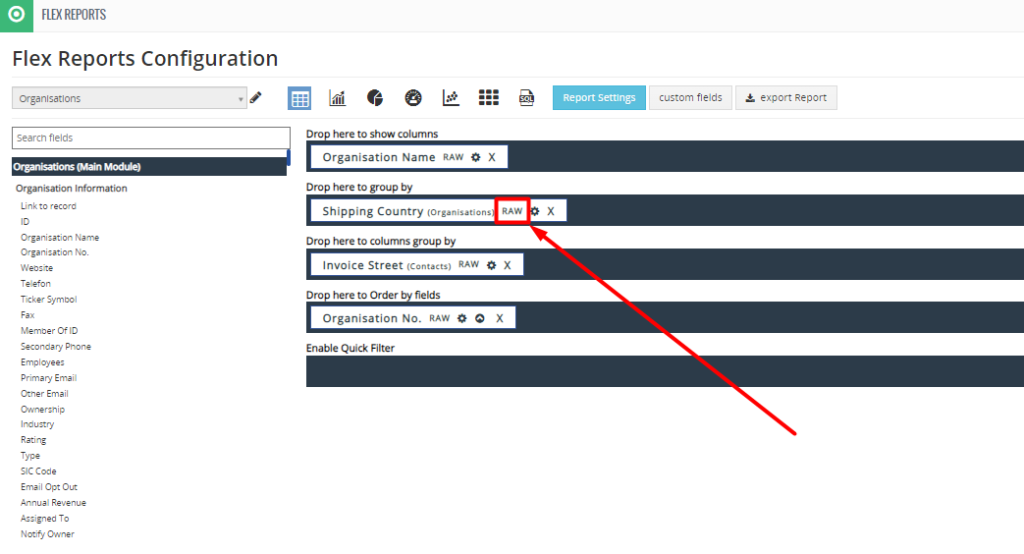
To change the field value, click here
After that a dropdown list with the following values is displayed
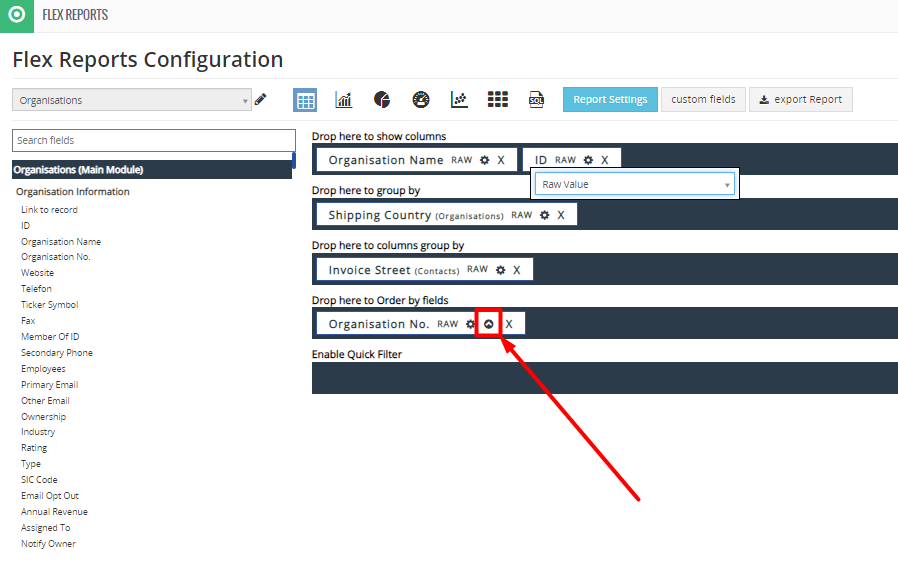
Click here to sort by value (larger, smaller)
If you want to customize the report, click here
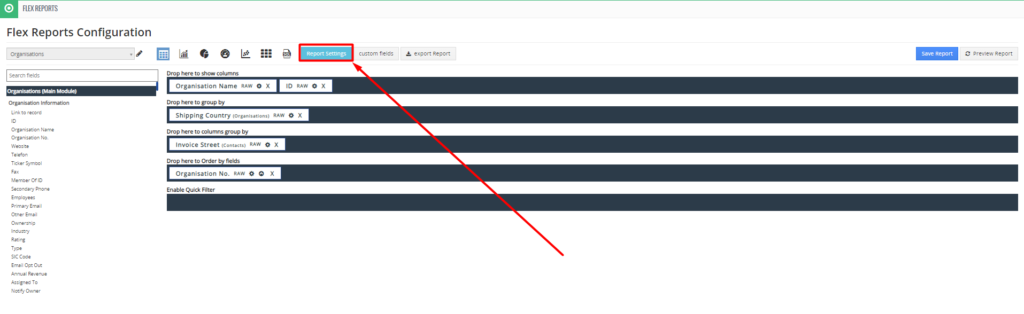
After that a window appears with fields for setting
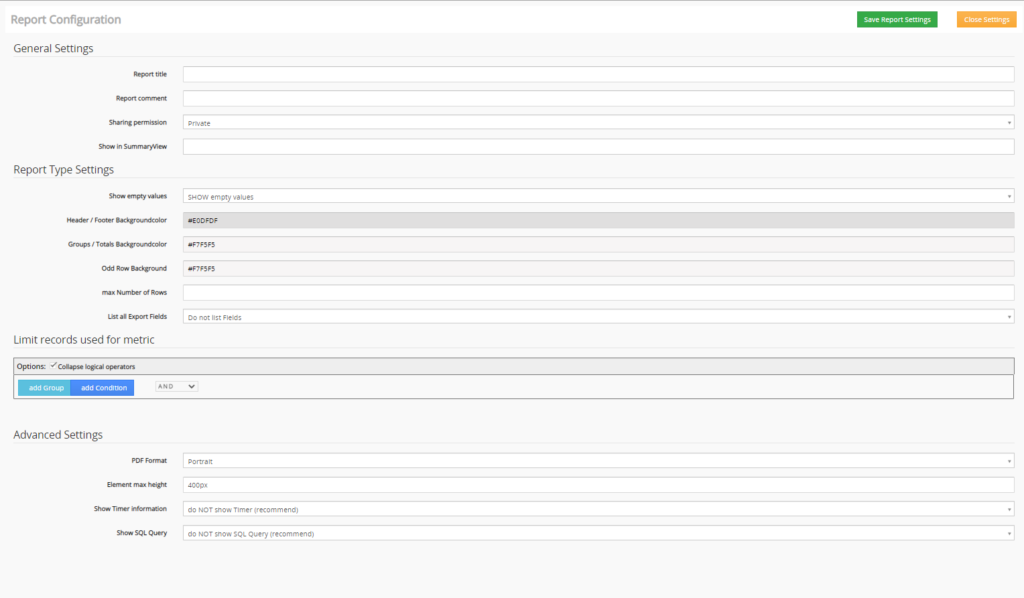
It is divided into blocks
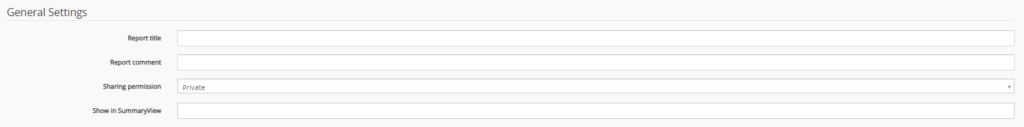
General settings
with fields to be filled in:
- Report title
- Comment on the report
- Permission to share
- Show in overview view
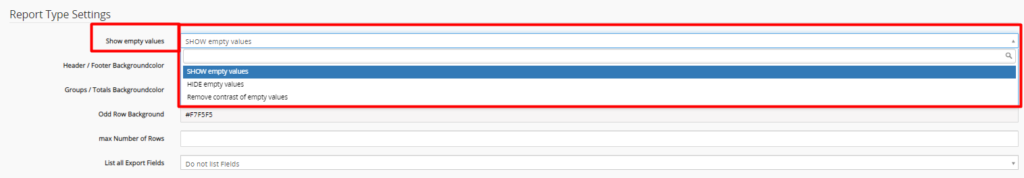
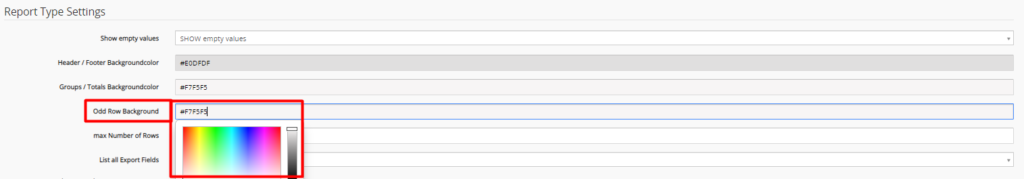
Report Type Settings
with fields to be filled in:
- Show empty values
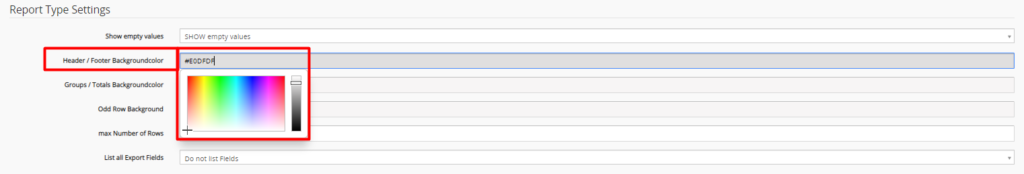
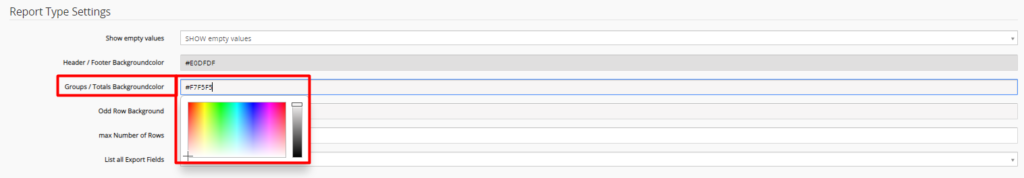
The fields described below refer to the selection of colors that determine the appearance of the report. The color in these fields can be selected from a palette or set in the HEX system. For example, a black circle in this system looks like this: #000000 .
- Header / Footer background color
- Groups / Totals background color
- Odd row background
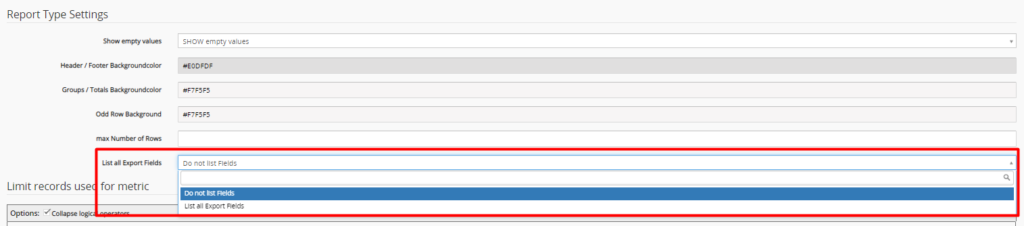
- max number of lines
- List all export fields
Limit datasets used for the metric
If you want to add a group, click “Add group” ,
and if a condition, then “Add condition”.

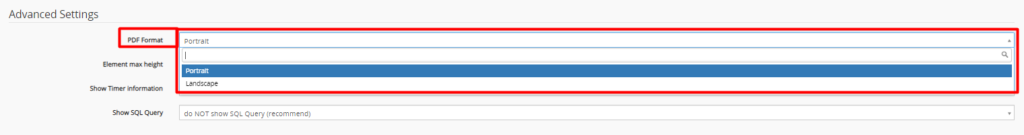
Advanced settings
with fields to be filled in:
- PDF Format
- Element maximum height
- Show timer information
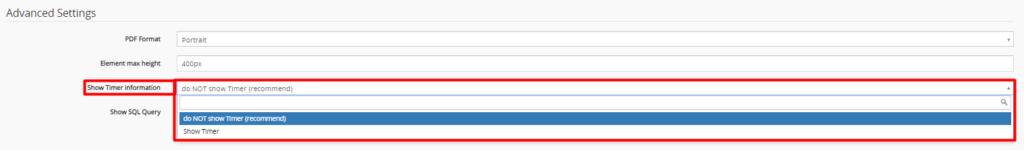
- Show SQL query

If you want to export the report, click here
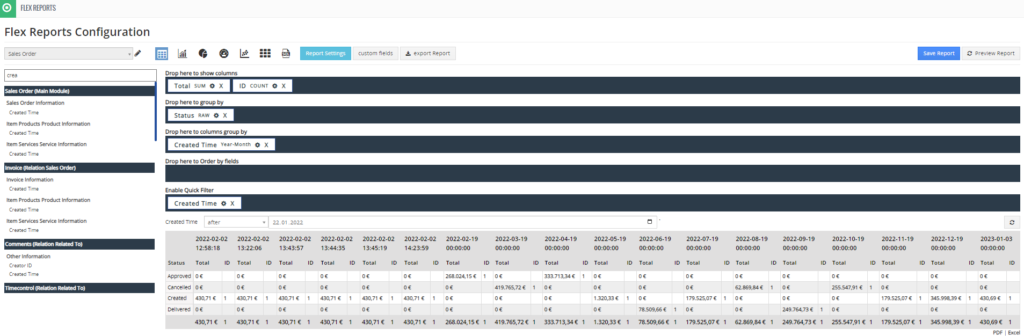
To preview your report, click on “Preview the report”.

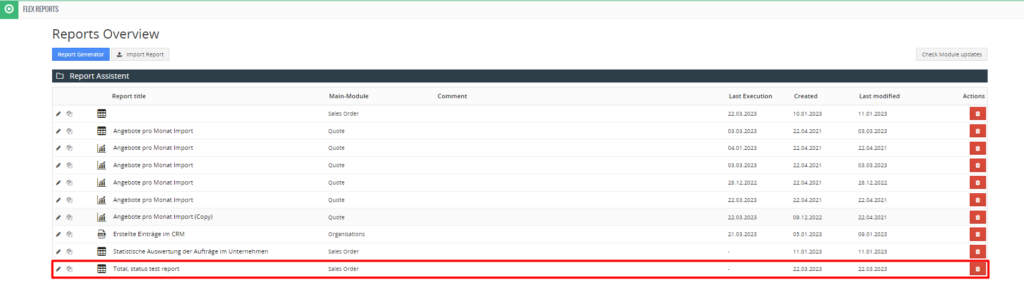
Here, for example, we have built a report as a table. The orders in the company are evaluated chronologically, by total amount, number and status.
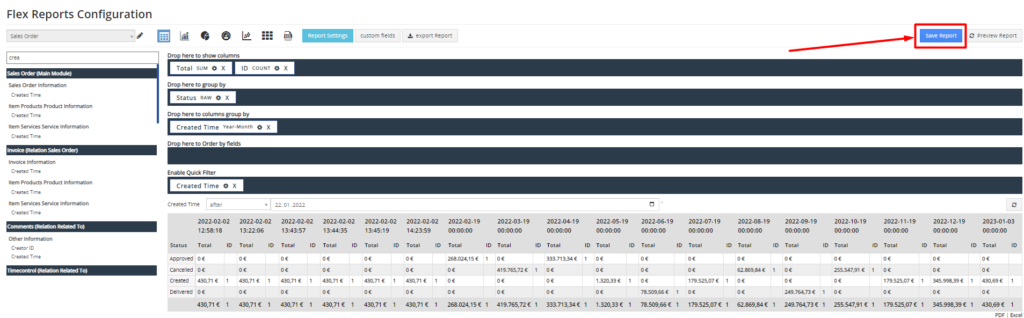
When you are satisfied with the created report and want to save it,
click on “Save Report
Then enter the name of the report and click “OK”.
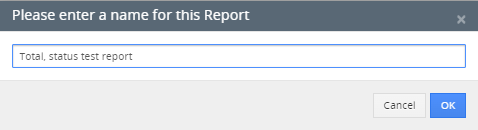
After that, the report you created will appear in the list of all reports